INAIO Guide Stage 1 3Functions and Graphs
3.1 Function notation and transforms
Read a function as an input-output rule, evaluate it carefully, and recognise how simple changes move its graph.
A function is a rule that gives one output for each allowed input. Function notation lets you state that rule once and ask many questions about it. A graph shows all of those input-output pairs at once. This language is used throughout later modules, from population models to classifier scores.
This is foundational algebra with an intermediate visual step. If substitution into a formula is familiar, start with OpenStax's function-notation lesson. Its graph-transformation lesson helps when it is hard to tell whether a change acts on the input or the output.
A basic idea: one input, one output
If , then . The expression asks for the output when the input is ; it does not mean multiplied by . A function's domain is the set of inputs it allows. For over the real numbers, the domain is , because a negative number under a square root has no real value.
A graph places each allowed pair on coordinate axes. A vertical line should meet the graph of a function at most once: one input cannot have two different outputs.
A quick tour of transformations
Start with a known graph . The following rules describe a new graph:
| New rule | Change to the graph, for positive |
|---|---|
| Move up | |
| Move right | |
| Multiply every height by | |
| Reflect across the horizontal axis | |
| Reflect across the vertical axis |
The horizontal shift can feel backwards: moves a graph right by , because the new input supplies the old input . If you combine changes, substitute carefully. For example, moves the original graph right , doubles its heights, and then moves it up .
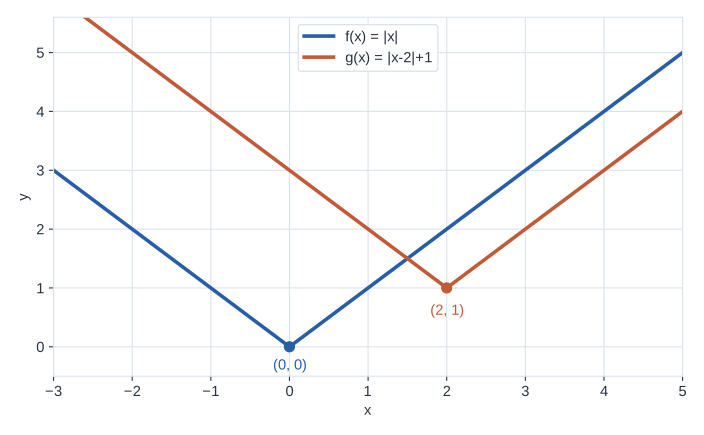
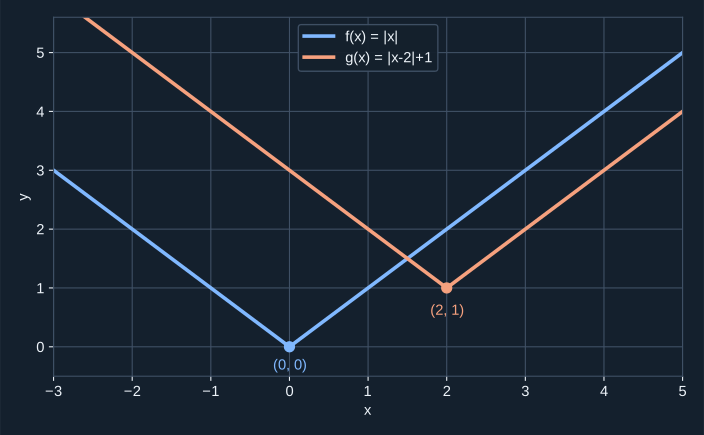
For a simple picture, take . The new rule moves its V-shaped graph right and up .
Application 1: reading a cost rule
A print shop charges a setup cost of units and units per item. Let , where is a nonnegative whole number. What is the cost of items, and how many items cost units?
- Evaluate the rule. units.
- Solve for the input. Set , so and .
- Check the domain. Both and are allowed whole-number counts. A formula can produce , but negative items are outside this problem's domain.
The function notation keeps the setup cost and per-item cost in one reusable rule.
Application 2: identify a moved graph
The graph of has its corner at . A new V-shaped graph has its corner at and the same steepness. What is its formula, and what does it output at ?
- Move the corner horizontally. Right by gives .
- Move it vertically. Up by gives .
- Evaluate and check. . The point is three units right and three units above the new corner, matching the original V's steepness.
Identifying a graph is easier when you first locate an anchor point such as a corner, vertex, or intercept.
Resources
| Source | Title | Why read it |
|---|---|---|
| OpenStax | Functions and function notation | Start with domains, outputs, and evaluating rules. |
| OpenStax | Transformation of functions | See shifts, reflections, and stretches on graphs. |
Finished this module? Mark it done.
Comments
Stuck on something, spotted a mistake, or found a resource that helped you? Tell us below.
Loading comments