INAIO Guide Stage 1 3Functions and Graphs
3.2 Linear and quadratic functions
Read constant change from a line and a turning point from a parabola, then connect each graph to its formula.
A line models a quantity that changes by the same amount whenever its input increases by one. A quadratic function models a change whose rate itself changes; its graph turns at a highest or lowest point. Recognising these two shapes helps you interpret costs, distances, areas, and scores without treating every graph as a new kind of problem.
This is foundational to intermediate algebra. Module 2.2 explains how to solve a line's equation; Module 2.3 explains how to find a quadratic's roots. Here those answers become points on graphs. Review linear functions before moving to quadratic functions in OpenStax.
A basic idea: constant change or a turning point
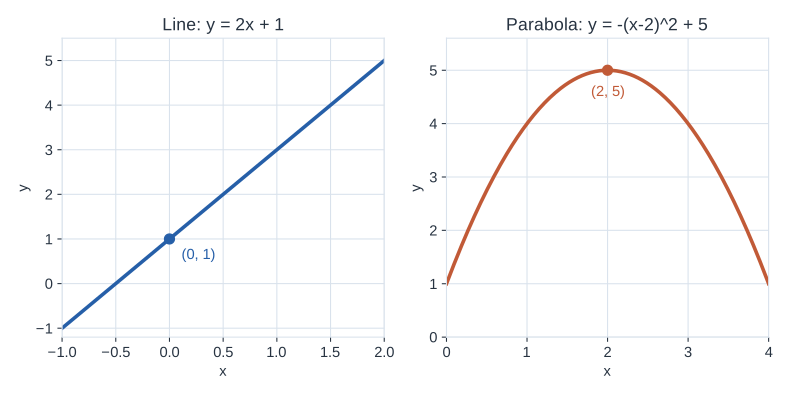
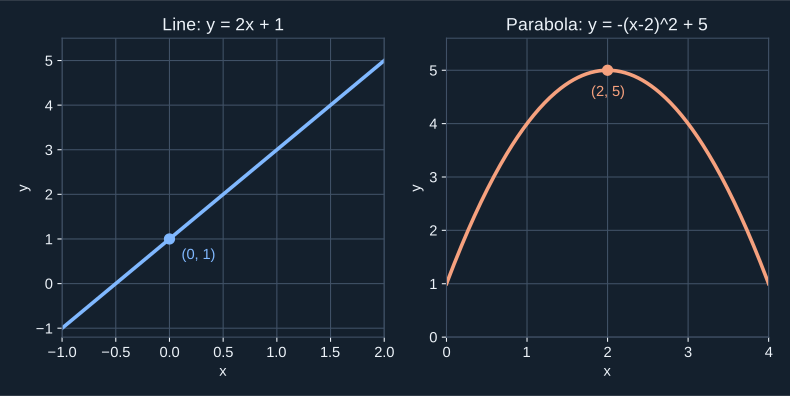
The line rises by whenever rises by . Its graph crosses the vertical axis at . The quadratic rises, reaches at , then falls. Inputs equally far from give the same output: .
A quick tour of formulas
For a line,
The slope is output change per unit of input; is the vertical intercept. A positive slope rises, a negative slope falls, and a zero slope is flat. Two points with different inputs determine one line.
A quadratic can be written in several useful forms:
In vertex form, is the turning point. In standard form, and . When the vertex is a minimum; when it is a maximum. The completing-the-square method explains where vertex form and come from. If a quadratic can be factored as with real , its zeros are and . A parabola need not meet the horizontal axis: when there are no real zeros.
Check the domain supplied by a word problem. A formula may accept negative inputs even when a distance, time, or count cannot.
Application 1: a fare with a fixed charge
A ride costs units to start and units per kilometre. What is the cost of kilometres, and what does each part of the graph mean?
- Write the line. For distance , .
- Evaluate. units.
- Read the graph. The vertical intercept is , the cost at zero distance. The slope is units per kilometre. Any 3 km increase, such as from to , adds units, whatever the starting distance.
The straight graph is evidence that the rate stays constant.
Application 2: a rectangle with fixed side sum
Two adjacent sides of a rectangle must add to units. If one side is , what is the largest possible area?
- Write the valid inputs and area. The other side is , so , with .
- Find the vertex. Here and , so . The area is square units.
- Check the meaning. The parabola opens downward, and is within the domain. The two sides are both . Values and each give square units, illustrating symmetry about .
The quadratic graph shows both the maximum and why moving either side away from reduces the area.
Resources
| Source | Title | Why read it |
|---|---|---|
| OpenStax | Linear functions | Learn slope, intercepts, and constant rates of change. |
| OpenStax | Quadratic functions | Study parabolas, vertices, and maximum or minimum values. |
Finished this module? Mark it done.
Comments
Stuck on something, spotted a mistake, or found a resource that helped you? Tell us below.
Loading comments