INAIO Guide Stage 1 3Functions and Graphs
3.6 Functions from their graphs
Read what a graph measures, extract its important features, and choose a formula that fits them.
A graph turns many numbers into a shape, but the shape is useful only when you read its axes and units. A rising line might mean increasing distance, cost, or error; those interpretations lead to different conclusions. Graph interpretation is needed whenever a question gives a plot instead of a formula or asks you to identify a rule from its behaviour.
This is intermediate work that combines earlier function ideas. OpenStax's lesson on graph behaviour covers slopes and turning points. Its function-notation lesson connects graphs with tables and formulas.
A basic idea: axes before shape
On a graph of distance from home against time, a flat segment means the distance is unchanged. It does not tell you whether the traveller is resting or moving in a circle around home. A downward segment means the traveller is getting closer to home; it does not mean time is running backwards. Read the horizontal variable, vertical variable, units, and scale before interpreting any line.
A quick tour of graph clues
| Feature | First question to ask | Labelled example |
|---|---|---|
| Axes and units | What does one unit in each direction represent? | The journey graph below uses hours and kilometres. |
| Vertical intercept | What is the output at input ? | The journey starts at ; the exponential graph in Application 2 starts at . |
| Horizontal intercept | Where does the output become ? | The journey graph returns to . |
| Slope | How much does output change per input unit? | The journey graph labels and km per hour. |
| Turning point | Where does increasing become decreasing, or the reverse? | Graph A below has a minimum at . |
| Repeated pattern | Is there a period? | Graph B repeats every input units. |
| Approaching a boundary | Is there an asymptote the curve nears but does not reach? | Graph C approaches the horizontal line . |
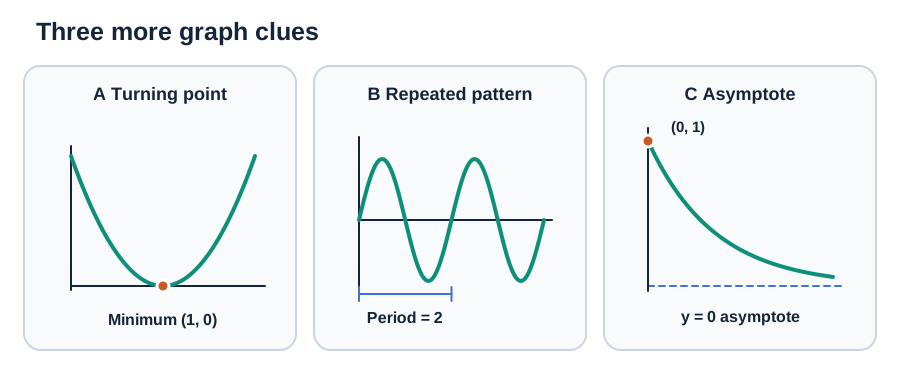
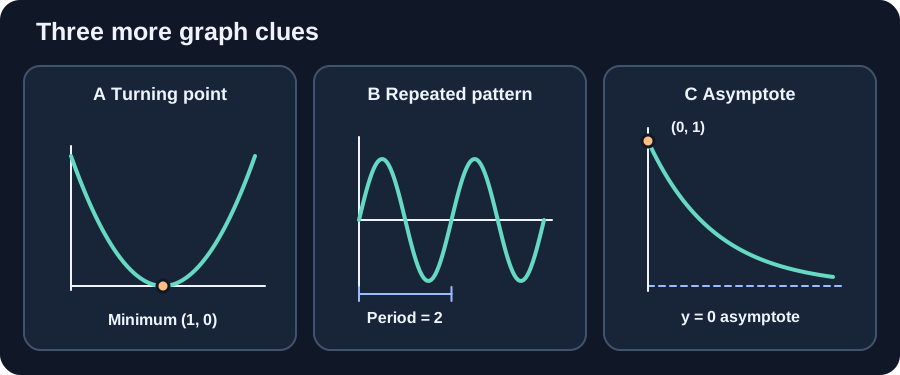
For two graph points and with , their average rate of change is . A constant rate suggests a line. Constant multiplicative change across equal input steps suggests an exponential. A symmetric U-shape, upright or upside down, suggests a quadratic, while repetition suggests a periodic rule.
These are clues, not proofs that a graph has one unique formula. A few plotted points can fit many rules. If a question offers candidate functions, test their values and features against the evidence shown.
Application 1: read a journey
The figure shows distance from home during a four-hour journey. How long is the traveller km from home, and what are the outward and return rates of change in distance?
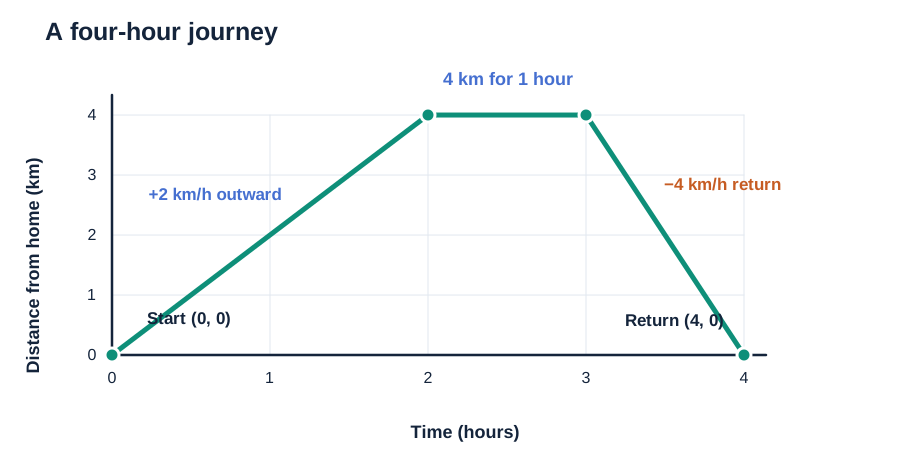
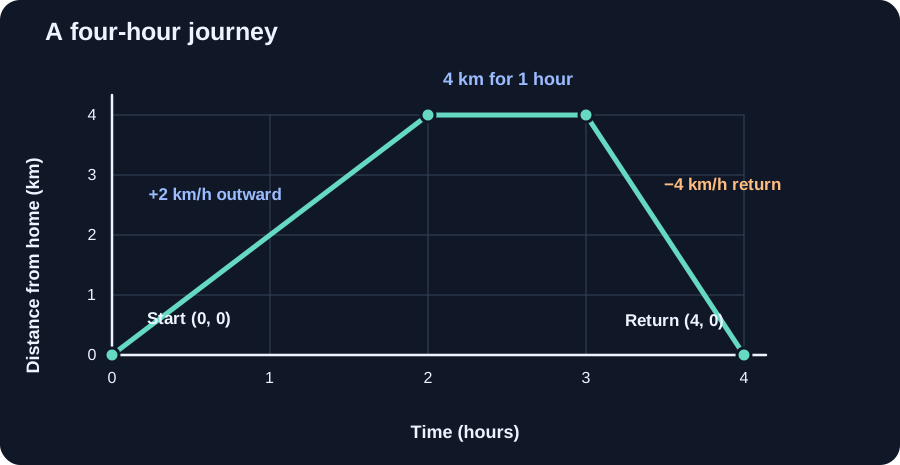
- Read the flat section. Distance is km from hour to hour , a duration of hour.
- Find the outward slope. Distance rises from to km over hours, so its rate of change is km per hour.
- Find the return slope. Distance falls from to km between hours and , so the slope is km per hour.
The negative slope says distance from home is shrinking. It is not a negative travel speed.
Application 2: identify a rule from values
The table gives four input-output pairs. Choose among a linear, quadratic, and exponential rule, then predict the next value under that choice.
| Input | ||||
|---|---|---|---|---|
| Output |
- Compare differences. The successive differences are , , and , so a linear rule with constant difference does not fit. The second differences, and , are not constant either, so no quadratic fits.
- Compare ratios. Each output is times the previous one. That points to , which gives all four values.
- Predict within the model. . The ratios suggest an exponential among the offered families; the four values alone cannot guarantee that every future value follows it.
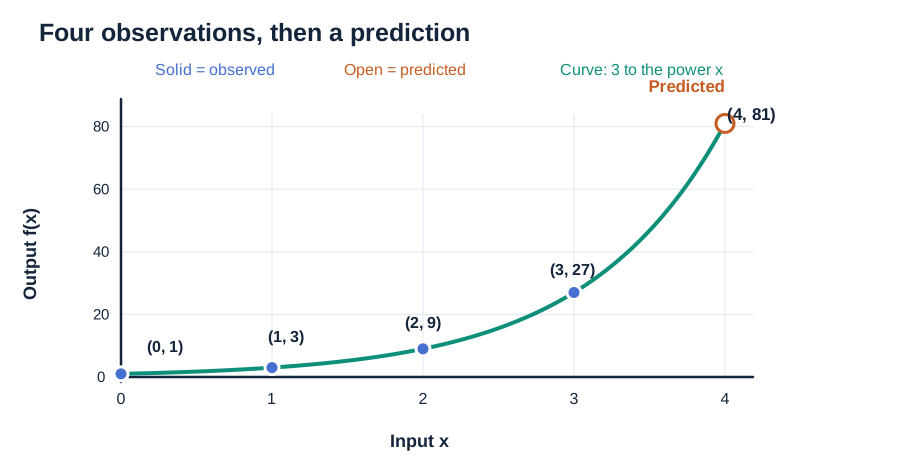
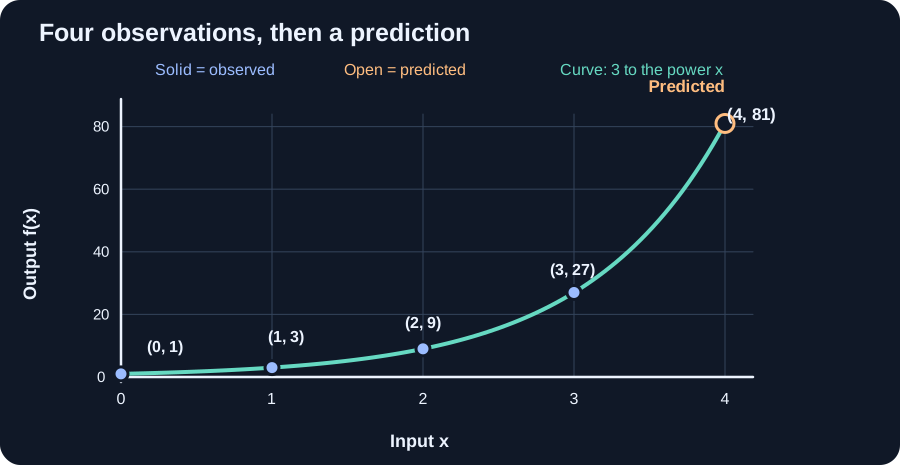
The last distinction matters: identifying a model from limited evidence is different from proving a rule for all inputs.
Resources
| Source | Title | Why read it |
|---|---|---|
| OpenStax | Rates of change and graph behaviour | Practise reading increasing, decreasing, flat, and turning sections. |
| OpenStax | Functions and function notation | Review how points, tables, graphs, and formulas describe one function. |
Finished this module? Mark it done.
Comments
Stuck on something, spotted a mistake, or found a resource that helped you? Tell us below.
Loading comments